
Archived decisions
Hampshire County Council | |||
Cabinet |
Item 7 | ||
26 June 2006 |
|||
Corporate Performance Report - 2005/06 full year results | |||
Report of the Chief Executive | |||
Contact: Jenny Heath, ext 7402 / Sue Sylvester, ext 7493
1 Summary
1.1 This report provides a summary of corporate performance for 2005/06. It proposes that extracts from the Corporate Performance Summary are published as part of the Performance Plan website by 30 June 2006 and that the key areas for action identified inform the development of the Corporate Business Plan for 2007/08.
2 Purpose of the Report
2.1 The Council has been developing its performance framework in the light of the recommendations made in the 2002 CPA Corporate Assessment:
`In order to use performance management more effectively to drive continuous improvement, the Council should:
· develop further output and outcome measures, and report these regularly to councillors for monitoring against targets
· ensure that corporate and service reviews are clearly outcome focused
· use performance indicators more proactively both corporately and at service level to drive improvements in performance
· ensure that targets for improvement are robust and stretching.'
While the Annual Audit and Inspection Letter has recognised progress, the spotlight will once again be put on performance management when the Council has its next CPA Corporate Assessment in 2007/08.
2.2 This report presents a summary and analysis of the corporate performance results for 2005/06, drawing attention to the key issues arising.
2.3 In addition to results for 2005/06, comparative BVPI (Best Value Performance Indicator) results for 2004/05 are included in this report. This is the latest comparative information available as final audited results for all councils were not published until December 2005 by the Audit Commission, which was too late for their inclusion in the half year corporate performance report in October.
2.4 Auditors comments on the accuracy of our BVPI performance results for 2004/05 are also included because of their potential impact on CPA results.
2.5 The performance messages from this report will be published in the Performance Plan on 30th June alongside other summaries of the Council's performance such as the CPA results and resident's survey findings.
3 Performance reporting process
3.1 Departments, having discussed their detailed findings at an Departmental Management Team meeting, will have shared their results with their Executive Member prior to this Cabinet meeting. This report therefore focusses on the overall performance of the County Council and is not accompanied by a compendium of all the departmental results, as in previous performance reports.
3.2 It is worth noting that these results have been compiled by departments aiming to meet the deadlines to achieve the statutory performance plan. However, departments are also subject to other statutory reporting deadlines and formats which creates a tension in meeting the corporate deadlines. As the reporting process has matured, we continue to refine reporting arrangements and the opportunities to manage performance.
4 Corporate Performance Summary
Key areas for action
4.1 Chief Officers have identified the following key areas for action, reflecting on the performance results and their plans for the coming year. These will inform the development of the Corporate Business Plan for 2007/08.
4.2 Front-line areas:
· Restructuring the Children's Services Department in order to achieve greater focus on early intervention and preventative services, with particular focus on improving outcomes for vulnerable groups of children.
· Supporting vulnerable adults through timely assessment, provision and review of their needs
· Improving the condition of our roads, improving safety and satisfaction with the road network and managing our capital infrastructure to prevent higher costs down the line.
· Improving access to public services (eg through the contact centre proposal), extending learning and recreational outreach programmes / activities and retaining bus passenger numbers and improving satisfaction with public transport information and services.
4.3 Back-office areas which support the above:
· Increasing value for money through the Adults Services recovery plan as well as continuous improvement through the efficiency agenda and corporate review programme
· Improving use of capital assets, including the review of council property and the refurbishment of Ashburton Court
· Developing organisational effectiveness - restructuring community focused services (for example, to support the Children Act), developing effective partnerships and maximising procurement efficiencies.
· Improving productivity through reducing staff absence, ensuring staff wellbeing, monitoring staffing numbers, implementing Pay and Benefits.
Appendix 1 shows performance information in support of the selection of these key areas for action.
Performance in relation to Corporate Strategy Aims 2005/06
4.4 The Corporate Strategy of the County Council is currently being revised to reflect the priorities of the Administration elected in May 2005. For 2005/06 - the Corporate Strategy aims and targets set by the previous Administration remained the focus of the County Council's activities - although some specific targets have been updated.
4.5 Appendix 2 details the progress made during 2005/06 towards achieving the general Corporate Strategy Aims.
Performance in relation to the Corporate Strategy Targets 2005/06
4.6 Appendix 3 details the progress made during 2005/06 towards achieving the specific targets of the Corporate Strategy.
4.7 The following chart shows the percentage of Corporate Strategy targets (those that were measurable) achieved by the end of March 2006:- 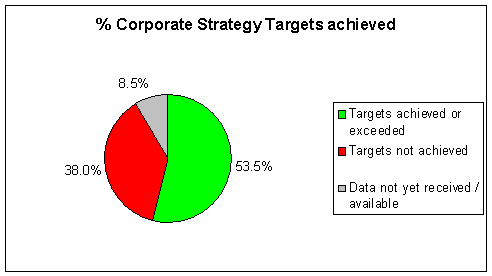
4.8 This shows that over 53% of targets were achieved, compared with only 35.3% achieved by the end of 2004/05 - confirmation that considerable progress was made during 2005/06.
4.9 Of the indicators that didn't meet the target - the majority of these were the Children's Services LPSA 1 `stretch' indicators, where particularly stretching `aspirational' targets were set in conjunction with the DfES. (In future years we may explore setting a `minimal acceptable threshold' figure for indicators such as this type. Only performance below the `threshold' would be reported as `red' and a matter of concern). Further targets that haven't been met are a couple that have fallen between departments and have not been properly `owned' by a manager or section and others partially outside the control of the authority (eg reconviction rates for young offenders, bad weather affecting numbers participating in the youth games).
The transition period between the former and new corporate strategies has hampered improving the way targets are set and at what level, in order to achieve both final and intermediate goals.
4.10 Areas of notable performance include:
· high levels of parents in family learning
· numbers of young people reached through youth work
· increased numbers of visitors to visitor sites and heritage open days
· the diversion of waste from landfill
· the target for new nursing care places was met
· the target for generating investment in tourism was met
· the numbers of fatal and serious road casualties on Hampshire's roads fell below the demanding LPSA1 target
These results, however, should be considered against a backdrop of maintaining the level of Council Tax in the lowest quartile and our low level of government funding.
Performance of Best Value Performance Indicators (BVPIs) 2005/06
4.11 For the BVPI year end data 2005/06, 54 % of all measurable BVPIs showed better performance, 11.1% stayed the same and 29.2% showed worse performance than their 2004/05 results with 5.6% of results not applicable or not yet available. This compares with 68% of 2004/05 BVPIs showing better performance, 7% staying the same and 25% showing worse performance than the 2003/04 results. However, the set of BVPIs in 2005/06 was different from the 2004/05 set of indicators owing to a fairly major revision of the BVPI suite from April 2005.
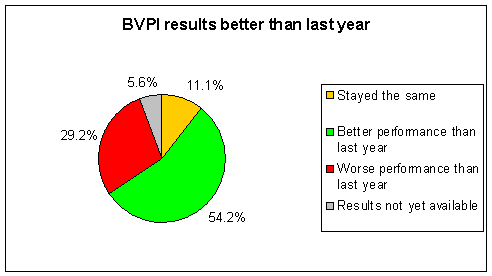
4.12 It is worth noting that of the 11.1% of indicators that `stayed the same', 2.5% (two indicators) were actually achieving 100% levels -a level from which it is not possible to achieve better performance.
4.13 Particularly notable performance was achieved in Adult Services where all the national indicators showed an improvement on the previous year and Childrens' Services with continuing improvement in National Key Stage tests and GCSE examinations - for example, in the percentage of pupils achieving 5 or more GCSEs at A* - C - set against already high levels of performance compared with national averages and statistical neighbours. Visits to museums have increased as also have visits to libraries, reversing recent trends.
4.14 Further notable performance was achieved in waste management - where, as a result of the investment in energy from waste plant the percentage of waste sent to landfill fell from 46 per cent to 19 per cent during the year - ensuring that Hampshire remains a national leader in this area. Road casualty levels for fatal and serious casualties fell a further 8 per cent on the previously lowest figure recorded in 2004.
4.15 Other areas of excellent performance in relation to the national indicators include an increase in services delivered electronically (from 74% in 2004/05 to 99% in 2005/06), further increases in buildings with facilities for the disabled and continuing high levels of performance in Trading Standards reflected in a 100% level of compliance with BV166b. The majority of Corporate Health indicators showed an improvement with increased percentages of staff from ethnic minority groups and declaring a disability and an increased percentage of invoices paid on time.
4.16 Areas of poorer performance include a slight increase in days sick per member of staff (from 7.34 days in 2004/05 to 7.65 days in 2005/06). This is felt likely to be due to improved and more accurate recording of sickness absence across the County Council, but especially in schools where recording on SAP has been introduced. The Corporate Review to improve attendance is recommending action to reduce sickness absence. The Equalities Standard for Local Government remains at Level 2. Cabinet have decided to alter the target from Level 3 to Level 2 in order to continue work on impact assessment and to align with the requirements of the revised CPA model.
4.17 The percentage of children with 3 or more foster placements during 2005/06 increased on 2004/05 levels, a performance target for which we were in the bottom quartile of county councils for 2004/05 results. A group of senior staff have been identified to work alongside a team of consultants appointed by the DfES to support Local Authorities in understanding and improving factors which impact on this target. This, together with continued investment in the fostering service to improve placement choice and the likely establishment of a specialist looked after children service, will help to improve performance in this area. Figures for care leavers in education, training and employment also showed poorer results than those for 2004/05. This area has been recognised as an area of concern and is a key priority within LPSA2, ensuring that attention is focussed on it.
4.18 Crime figures provided by Hampshire Constabulary show an increase in burglaries and vehicle crimes during 2005/06 - although compared with national results the figures are still likely to be good.
4.19 The high volumes of data required to complete the new road condition surveys and delays in government guidance about how the results are to be presented has caused a serious data processing backlog which has only just been overcome by the firm commissioned to do the work. Data for two of the four indicators (footways and unclassified roads) has been received. The other two (principal roads and classified roads) is expected soon. This delay is potentially of real concern as these two are also CPA indicators and it is currently proposed that having no data for an indicator will place it below the lower threshold.
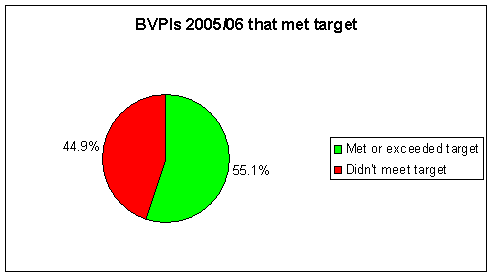
4.20 Regarding performance against target, 55% of indicators equalled or bettered their target, a very slight fall on results for 2004/05 when 56% of indicators equalled or bettered their target.
4.21 Further analysis of information of this type will be possible when the performance management system is in installed.
4.22 A list of all Corporate Best Value Performance Indicators is shown as Appendix 4.
Comparative Performance of the County Council 2004/05 .
4.23 The Council aims to have a high percentage of its national performance indicator (BVPI) results in the top quartile compared with other county councils. For 2004/05, 40% of indicators were in the top quartile, an increase of 4 % compared with 2003/04 performance results. However, the percentage in the bottom quartile increased by 10%, whilst those in the third quartile decreased by 10% which might indicate that our weaker areas of performance are not improving at as great a rate as that of other local authorities
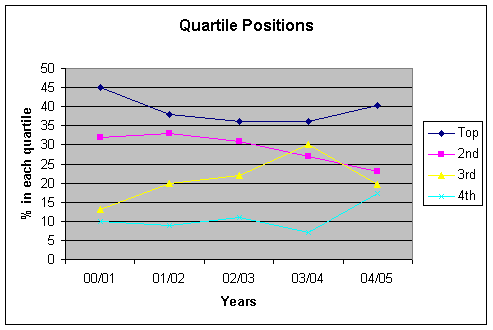
4.24 The Executive Member for Performance, Efficiency and Communications will be continuing his programme to review areas that fall into the bottom quartile.
5 Audit of BVPI performance results 2004/05
5.1 For the 2004/05 performance results, the District Auditor `reserved' 3 out of the 97 Best Value Performance Indicators. This is one less reservation than in 2003/04 and continues the improvement in the accuracy of our performance reporting from 2001/02 levels when the auditors `reserved' 18 out of 87 indicators. The audit of the 2005/06 results is taking place in three stages this year beginning at the end of June.
5.2 The latest consultation on CPA 2006 is proposing that any reserved or missing BVPIs (and non-BVPI data items) are scored as being below the lower threshold. It is therefore very important that the accuracy of our performance reporting is maintained, to avoid the risk of low PI element scores.
6 Public reporting of performance
6.1 The above corporate summary plus the departmental reports will form the basis of:
· The revision of the overall summary of performance in the Performance Plan on Hantsweb, updated to meet the statutory deadline of 30 June
· The Value for Money self-assessment required in July, relating achievements to expenditure. This is part of the revised CPA model and represents a highly weighted element of the new model.
· The direction of travel self-assessment to be submitted to the Audit Commission in September 2006.
Recommendations
The following decisions are sought:
1 That Cabinet agree that the `corporate performance summary - key areas for action' will inform the development of the Corporate Business Plan for 2007/08.
2 That extracts from the corporate performance report and the results are published as part of the Performance Plan website by 30 June 2006.
Section 100D - Local Government Act 1972 - background papers
The following documents disclose facts or matters on which this report, or an important part of it, is based and has been relied upon to a material extent in the preparation of this report.
Departmental returns of performance results - held by the Corporate Performance Team and by departmental performance contacts
N.B. The list excludes:
1. Published works
2. Documents which disclose exempt or confidential information as defined in the Act.