
Archived decisions
HAMPSHIRE COUNTY COUNCIL
Decision Report
Decision Maker: |
Executive Lead Member for Children's Services | ||||
Date of Decision: |
15 October 2009 | ||||
Decision Title: |
Children's Services Department 2009/10 Revenue Budget Monitoring - Period 5 (end of August 2009) | ||||
Decision Reference: |
921 | ||||
Report From: |
County Treasurer and Director of Children's Services | ||||
Contact name: |
Gordon Shinn | ||||
Tel: |
01962 847545 |
Email: |
|||
1. Executive Summary
1.1. The purpose of this paper is to set out for the Executive Lead Member for Children's Services the current position on the Children's Services revenue budget for 2009/10 as at the end of August (period 5).
1.2. The report sets out the key emerging financial pressures faced by the department in 2009/10 relating primarily to activity-led areas, currently resulting in a forecast pressure of £4.6m (£1.0m Schools Budget, £3.6m non-schools budget). However, it is anticipated that the pressure on the Schools Budget will reduce as updated information is received, and further actions being taken on the non-schools budget are expected to reduce the overspend by approximately £0.9m to £2.7m.
2. Contextual information
2.1. The 2009/10 budget was agreed by the County Council on 19 February 2009.
2.2. Appendices are listed at paragraph 12.1.
3. 2009/10 Revenue Budget Summary as at 31 August 2009 (period 5):
3.1. The overall 2009/10 cash limited budget for Children's Services has increased since the original budget was set in February 2009 as outlined below:
Schools £000 |
Non-Schools £000 |
Total £000 | |
Original Agreed Cash Limited Budget |
803,587 |
166,654 |
970,241 |
Approved Changes: |
|||
Grant adjustments and other minor changes |
7,626 |
4,385 |
12,011 |
Current Cash Limited Budget* |
811,213 |
171,039 |
982,252 |
*Excludes assumptions around Schools Budget carry-forward to 2010/11.
3.2. The projected outturn reported for 2009/10 is an overspend of £4.6m. It is currently anticipated this position can be reduced by approximately £0.9m (against the non-schools budget) to achieve an overspend of £3.7m. The variance reported by each branch and by Schools Budget and non-schools budgets is as follows:
Period 5 | |
£000 | |
Performance & Resources |
-851 |
Education & Inclusion |
+1,852 |
Children & Families |
+3,617 |
Total |
+4,618 |
Less anticipated impact of further management action |
-855 |
Adjusted position |
+£3,763 |
Broken down by: |
|
Schools Budget |
+1,046 |
Non-schools budget |
+2,717 |
Total |
+3,763 |
3.3. This position includes an assumption that approximately £4.3m of Schools Budget will be carried forward in full to 2010/11 as agreed by Schools Forum. This consists of:
· £1.4m to meet the cost of equal pay claims (of which £0.5m had been carried forward from 2008/09)
· £0.15m in relation to budget previously allocated to meet the cost of Independent Safeguarding Authority checks which will now not be incurred during 2009/10
· £2.7m in response to the anticipated funding pressure which is expected to arise during 2010/11 in respect of payments for 3 and 4 year olds (including extending and increasing flexibility for free entitlement).
3.4. A number of significant issues contribute to the position currently reported for the service. These include:
· an increase in the number of children and young people supported in the activity-led budget areas such as Special Educational Needs (SEN) and Out County Special School Placements, Home to School Transport and Children Looked After
· the low bank base rate, which means that there is an estimated £0.5m shortfall on the budget for Interest on School Balances
· increased costs in relation to some services, especially Home to School Transport, where increasing fuel prices may impact on some contract prices (despite the current economic climate), and Special Educational Needs (SEN) Out County Placements where inflation increases have been agreed regionally at a 2.8% increase for residential schools (0.3% above the inflation allocation of 2.5%).
3.5. A number of other emerging factors will further affect the final position. The department has already taken steps to reduce the overspend position reported (the outcomes of which are reflected within the forecast outturn) and further plans are currently being developed intended to further reduce the forecast overspend by approximately £0.9m (from £4.6m to £3.7m). Key actions include:
· a review of some team structures to bring these in line with the budget available. Lower levels of staffing vacancies during 2009/10 than in previous years has placed additional pressure on employee budgets (see paragraph 4.5)
· strategies intended to reduce the number of children who are looked after (e.g. further rollout of the Intensive Support Service model across other areas of the County Council)
· further negotiation with Hampshire Primary Care Trust around financial contributions being sought in relation to children and young people with complex health needs
· a review of existing service provision to ensure it is effectively meeting the needs of children and young people whilst achieving value for money (e.g. social care packages for care leavers and provision of transport to support contact arrangements with Children Looked After by the County Council)
· consideration of invest to save opportunities
· a review of Business Units' business plans in relation to the core contribution made by the department.
3.6. In addition, the department will continue to review all service budgets with the aim of identifying further savings to offset the wider department pressures.
4. Key Activity, Performance and Workforce information
4.1. The department is developing links between budgets, performance and human resource information and has implemented an integrated planning approach that embraces these elements.
4.2. Appendix 2 provides details of activity data from which is extracted the key activity led/high risk budgets that are reported to Cabinet. Appendix 2 (c) shows the first quarter's figures (April - June 2009) that were reported to Cabinet on 28 September 2009. The trends in activity and spend are explored in more detail in section 5.
4.3. Appendix 2(d) provides information on staff in post, turnover and sickness absence at the end of the first quarter (June 2009). There is a planned increase (funded from either grant, DSG or additional growth received, e.g. the investment in safeguarding) in both the number of employees and FTE in post at the end of the period. In the current year there is an increase of 105 FTEs, which is largely due to:
· the appointment of additional staff in the Children and Families branch to support front line social workers following the additional budget growth received in relation to safeguarding (see paragraph 5.30)
· the continued roll out of Children's Centres and associated staff appointments
· appointment of visiting music teachers
· the appointment of a number of new clerks to governors posts as part of the Business unit to enable them to begin training which has been funded from within the Schools Budget
· the filling of a number of Personal Adviser posts
· a number of posts, granted funded, that have enabled the appointment of staff on fixed term contracts.
4.4. Across the County the effect of the current economic climate is affecting turnover and recruitment. Retention of staff is generally higher than in the past and there are good response rates for vacancy advertisements.
4.5. The financial impact has been to create pressures on staff budgets where it had been assumed that similar turnover levels as in previous years was budgeted. As at 30 June, the total number of employees was 3.1% higher than budgeted numbers, whereas the overall staff budget shows a pressure of 0.8%.This is explored in more detail in appropriate budgets in section 5.
4.6. The overall sickness figures for the department are showing a small upward trend. Whilst better recording may account for some of this, it is clear that continued close monitoring is required, including ensuring that managers at all levels are holding return to work discussions and supporting proactive absence management. Financial impacts are highlighted within relevant budget areas in section 5.
4.7. Detailed performance information is not available. However, an internal analysis of quarter one data for some Children's Services National Indicators (NIs) demonstrates a positive trend overall from 2008/09 year end, with improvement in some important areas, including placement stability, repeat child protection plans and the proportion of 16-18 year olds not in education, employment or training (NEET). However, these remain key areas for improvement over the remainder of the year. In total, 50% of the NIs that are available show an improvement, 7% are holding steady and 43% are showing a small fall in performance.
5. Major budget variations
5.1. The major variations of the forecast outturn based on the position as at the end of August (period 5) against the cash limit are as follows:
Cash Limit £000 |
Variance £000 |
Variance % |
Report para | |
Schools Budget |
||||
LMS Contingency |
9,065 |
-199 |
-2.2 |
5.3 |
Teachers Threshold Payments and Performance Related Payments |
19,084 |
-190 |
-1.0 |
5.5 |
Education Inclusion Service |
8,718 |
+315 |
+3.6 |
5.7 |
Inter Authority Recoupment |
615 |
+197 |
+32.0 |
5.9 |
Out of County Special Schools |
8,764 |
+960 |
+11.0 |
5.10 |
Non-Schools Budget |
||||
Interest on Schools Balances |
-490 |
+510 |
+104.0 |
5.16 |
Government Grant (2008/09 Unaccompanied Asylum Seeking Children) |
165 |
-165 |
-100.0 |
5.20 |
Home to School Transport |
24,414 |
+1,166 |
+4.8 |
5.21 |
Locality Teams (Education Welfare Officers) |
1,842 |
+121 |
+6.6 |
5.28 |
Commissioning and Social Work |
14,229 |
-287 |
-2.0 |
5.31 |
Children Looked After |
32,523 |
+1,819 |
+5.6 |
5.34 |
Family Support Services |
8,262 |
+265 |
+3.2 |
5.60 |
Youth Justice (includes Secure Unit) |
340 |
-222 |
-65.3 |
5.64 |
Other Children's Services |
7,604 |
+1,027 |
+13.5 |
5.65 |
Services for Young People (Connexions Consortia and District Youth Teams) |
11,563 |
+152 |
+1.3 |
5.70 |
Unallocated Budget |
908 |
-605 |
-66.6 |
5.71 |
5.2. The following paragraphs provide details on these variations.
Schools Budget
Local Management of Schools (LMS) Contingency -£199,000 (-2.2%)
5.3. This budget includes amendments made to schools' budget allocations, as well as Nursery School payments, money for excluded pupils and payments to schools for newly qualified teachers.
5.4. The underspend reported mainly relates to an increase of £196,000 in the cash limit against the LMS contingency in respect of Schools Budget which had previously been allocated to Early Years (for the New Opportunities Fund) but which is no longer required for this purpose. This is, therefore, now available to offset other pressures within the Schools Budget.
Teachers' Threshold and Performance Related Payments
-£190,000 (-1.0%)
5.5. The current estimate for teachers' threshold payments is based on claims received to date as well as a forecast for the remainder of the year. The underspend is primarily due to a lower number of claims relating to 2008/09 being received than had been originally envisaged.
5.6. This budget also includes payments to schools in relation to performance related pay for teachers. Currently the budgeted amount has been allocated to schools. However, increasing numbers of centrally based teachers (e.g. within the Music Service, Children's Centres and Early Education and Childcare Unit) could place additional pressure on this budget, resulting in a reduction in the current variance reported. Further work is required to establish the impact of these changing activity levels and an update will be provided in the next report.
Education Inclusion Service +£315,000 (+3.6%)
5.7. A significant proportion of this forecast overspend relates to staff expenditure where it has been necessary to incur extra costs in order to provide cover for absent staff as well as responding to the increased number of children being supported through the service. There has been an increase of approximately 8% in the number of pupils supported by the service compared to the same period last year. Based on previous statistics the summer term is when demand for services is greatest and it is hoped the numbers of pupils will reduce in the next two terms. This could lead to a reduction in the level of spending but it is too early to determine whether this trend will continue this year.
5.8. In addition there has been an increased requirement to provide individual packages for pupils, including college placements, in order to respond to Ofsted feedback and meet statutory responsibilities.
Inter-Authority Recoupment +£197,000 (+32.0%)
5.9. The budget represents the net position of payments and receipts arising from Hampshire pupils placed in other local authority schools and vice versa. The forecast outturn against this budget is based on known current activity levels, but this is subject to change throughout the year. A clearer position regarding this budget will become known once the autumn term school placements have been confirmed.
Out County Special Schools +£960,000 (+11.0%)
5.10. This position reflects the position for the 2009/10 academic year based on September starters. In addition, an assumption has been incorporated into the forecast regarding the outcomes of current tribunal appeals.
5.11. Activity information clearly demonstrates that there has been an increased demand for Out County Placements over the past two academic years (3.6% increase between September 2008 and 2009). The assumptions related to potential tribunal outcomes suggest that this increase could continue during the 2009/10 academic year.
Number of placements | ||||
2006 |
2007 |
2008 |
2009 | |
January |
- |
214 |
221 |
234 |
April |
- |
227 |
234 |
245 |
September |
218 |
211 |
222 |
230* |
*Estimated activity for September 2009 (subject to change pending final confirmation of pupils. This position also excludes the outcome of tribunals currently in progress).
5.12. In addition to the increased number of placements, the average unit cost of a placement has also increased from approximately £38,000 to £39,700 (a 4.5% increase).
5.13. It should also be noted that inflation increases for 2009/10 above the 2.5% budget increase allocated will have further contributed the increased unit cost and overspend reported against this budget (the regional fee negotiation process has set exceptional fee levels at a maximum of 2.8% for residential school placements).
5.14. A number of strategies are currently being explored to address the level of overspend reported for Out County Placements (e.g. re-negotiation of school fee levels with providers). However, it is not expected that these will impact on the service until the 2010/11 financial year at the earliest.
Non-Schools Budget
Interest on School Balances +£510,000 (+104.0%)
5.15. The Children's Services department retains any interest earned on balances for primary, special and nursery schools, after paying them a nominal amount of interest (at 0.1%). An estimated reduction in income of £750,000 was included in the 2009/10 budget, based on reduced levels of balances and lower interest rates. The assumed interest rate was 2.5%.
5.16. Interest is received at 0.5% below the Bank of England base rate. As the base rate is currently 0.5%, if interest rate levels were to remain at this level no interest would be received.
5.17. The current assumption is that base rate will not change between now and the end of the financial year. If the weighted average base rate for this financial year were to increase above 0.5% then this pressure will be reduced. For each 0.5% rise in base rates the interest received will increase by approximately £9,000 per month.
5.18. The projected outturn includes £23,000 in respect of the interest which the department is obliged to pay to primary, special, and nursery schools.
Government Grant (2008/09 Unaccompanied Asylum Seeking Children)
-£165,000 (-100.0%)
5.19. This reflects a one-off additional grant payment that will be received from the Home Office in respect of Unaccompanied Asylum Seeking Children claims relating to the previous financial year, but which had not been agreed at the time the 2008/09 accounts were closed.
Home to School Transport +£1,166,000 (+4.8%)
5.20. This is an activity-led budget, which (despite having had much additional resource added over the years including £575,000 in 2009/10) has been under constant pressure for several years. As well as transport inflation being high, there has been an increase in contract numbers (the main cost driver).
5.21. The following table shows that there has been an increase in the level of activity against this budget over the past financial year.
Number as at June 2008 |
Number as at May 2009 |
Increase % | ||
Pupils transported (A) |
Mainstream |
12,077 |
12,158 |
0.7 |
Special / EIS |
2,406 |
2,540 |
5.6 | |
Total |
14,483 |
14,698 |
1.5 | |
Season Tickets (B) |
2,293 |
2,382 |
3.9 | |
Pupils transported by contract (A) - (B) |
12,190 |
12,316 |
1.0 | |
Number of Contracts |
Mainstream |
763 (May) |
797 |
4.5 |
Special / EIS |
640 (May) |
689 |
7.7 | |
Total |
1,403 (May) |
1,486 |
5.9 |
5.22. This table demonstrates that a significant proportion of the growth in pupil numbers (5.6%) since June 2008 relate to an increase in those educated in either special school provision (SEN pupils in mainstream are included with the mainstream pupil numbers) or other non-mainstream school arrangements such as pupil referral units.
5.23. The forecast overspend includes:
· £229,000 (6.1%) on escort costs. This position includes a pressure of £201,000 in respect of salary costs. This is a mixture of Pay & Benefits costs where escorts have moved from a `spot salary' to an incremental pay scale (£105,000), as well as increased hours worked (£96,000) due to a combination of more pupils requiring escorts and longer journeys being made as reflected in the activity information shown above. The remaining £28,000 relates to the cost of the three yearly CRB renewal checks which will be undertaken during 2009/10
· £872,000 (4.4%) in respect of contract costs, including an increased number of contracts, the effects of above inflation price rises, offset by planned transport reviews and spend to save initiatives. Further information is provided in paragraphs 5.24 and 5.25 below regarding these issues
· season ticket costs are forecast to overspend by £64,000 (5.3%) as a result of estimated increases in respect of entitlement to season tickets in secondary and FE sectors. Numbers for the new academic year are currently unknown so this position could change.
5.24. The activity information provided above identifies that the number of contracts has increased disproportionately to the number of pupils (5.9% compared to 1.0% respectively). It is difficult to establish a direct relationship between these statistics as often the type of contract and the number of pupils transported will depend on the circumstances of the individual children. For example, a contract could be for a coach to transport approximately 80 pupils to a mainstream school, or a taxi transporting an individual pupil to an independent school. The increase in activity against the Out County Placement Schools budget, therefore, has a direct relationship with this budget. The activity information above demonstrates that the number of pupils attending either a special school (County Council owned or independent) or other school arrangement (such as a pupil referral unit) has increased significantly since June 2008 (5.6%) and it is, therefore, likely that this has resulted in the need for more contracts involving a smaller number of pupils. Changes in the behaviour, school or home address of some SEN pupils can also result in the need for additional contracts or changes to contracts where no change in pupil numbers is observed.
5.25. Contracts are re-priced on an annual basis; annual contracts automatically in September and daily contracts on request at the anniversary date of the contract. The rate of increase in September 2008 was 3.0% and for September 2009 this will be 1.1% (reflecting the economic downturn). The inflation provision made within the forecast outturn allows for this standard re-pricing of contracts. However, other non-inflation related contract price increases have resulted in a budget pressure emerging. These include:
· other operator related changes where the cost of delivering a contract has increased. Examples include the need to re-tender for a contract due to poor performance of an operator and the cost of the new contract is higher, or where changes in road conditions or road closures result in increased charges being levied
· pupil related increases which result in an increase in contract value. An example here would be a change in the number of miles a pupil is transported where they change school or move home.
5.26. Home to school transport is a key focus for the Corporate Efficiencies targets and Children's Services will be working closely with the Corporate Efficiencies Board and Environment Department to effect the target savings in the vehicle procurement contract costs. These savings will not be available to offset any future years' overspend as they are part of the central efficiencies targets. At the same time Children's Services will be reviewing policy, entitlement and exceptions activity and the impact of SEN decisions on costs and these efficiencies will remain within the department. There is also potential for consideration of a restructure of the process between Children's Services and Environment Grouping, which, if supported by changes to IT systems could produce savings in administrative costs.
Locality Teams (Education Welfare Officers) +£121,000 (6.6%)
5.27. This budget represents the non-schools budget funded element of the Locality teams (i.e. the Education Welfare Officer salary costs).
5.28. The overspend has arisen against this budget due to many of the staff being paid above mid-point of the salary grade at which the service is budgeted and as a result of low turnover of staff resulting in fewer vacancy savings emerging so far during the year.
5.29. Further work is currently being undertaken to review the team structures with the aim of realigning these within the available budget as further vacancies emerge. It is, therefore, expected that this position will reduce throughout the remainder of the financial year.
Commissioning and Social Work -£287,000 (-2.0%)
5.30. Despite recent recruitment success, the overall position reported against this budget is an underspend of approximately £287,000. This includes a forecast underspend of approximately £160,000 against the additional safeguarding budget of £1.2m, which was based on full year costs. However, although the recruitment process started as soon as possible, it was not possible to fill all posts by 1 April.
5.31. Whilst recruitment to many of the vacant qualified Social Worker posts experienced last year has been successful (the outcome of the last recruitment campaign resulted in all vacant posts being recruited to), turnover through the year has further contributed to the underspend reported. This is demonstrated through the current planned recruitment campaign, which is looking to appoint to a further 19 qualified social worker and nine senior practitioner posts, across various budgets. Assumptions around recruitment to these vacancies have been incorporated into the relevant forecast outturns. For example, further expenditure relating to the Family Placement team vacancies will be reflected as part of the in-house fostering cost within the Children Looked After budget.
5.32. The budget savings achieved this year have been partially offset by an estimated overspend of £120,000 in respect of the anticipated contribution to Adult Services for the Out of Hours (OoH) service (of which £84,000 relates to the dedicated Children and Families OoH team).
Children Looked After +£1,819,000 (+5.6%)
5.33. Activity levels for Children Looked After (CLA) steadily increased over the later part of 2008/09, from 1,023 as at 31 March 2008 to 1,084 at 31 March 2009 (an increase of 6.0%). Since the beginning of the financial year activity levels have fluctuated slightly (as demonstrated in the graph below). However, as at the end of August the number of CLA was reported to be 1,084 remaining, therefore, in line with the position reported at the end of March 2009. 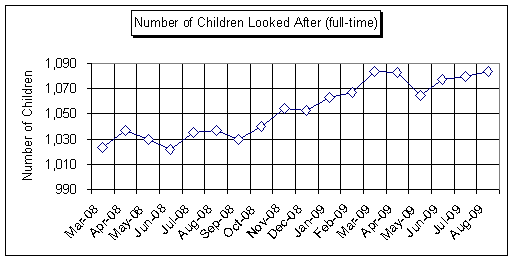
5.34. The average unit cost of a child looked after full-time (direct costs only and excluding short-term breaks) was approximately £593 per week in 2008/09. The estimated average unit cost in 2009/10 is £578 per week, a reduction of £15 per week (2.5%). This change mainly relates to a reduction in the estimated unit cost of Independent Fostering Provider placements (approximately 6.2%).The average number of children looked after has increased by approximately 3.8% over the past year (from 1,044 during 2008/09 compared to 1,084, based on the assumption that activity will continue at current levels).
5.35. These children are in a number of different placement arrangements including fostering and residential care, as well as other arrangements such as supported lodgings, secure welfare accommodation (secure remand accommodation arrangements are not reflected within Children Looked After activity or expenditure), children placed for adoption (subject to final approval), as well as in some circumstances living at home with their parent(s) on care order. It excludes children with a disability who receive short programmed breaks.
Number of children in full-time care by children with a disability (CwD) and non-disabled children) |
March 2008 |
% |
March 2009 |
% |
August 2009 |
% | |
Non-county placements |
Non-disabled |
14 |
1.4 |
14 |
1.3 |
17 |
1.6 |
CWD |
40 |
3.9 |
37 |
3.4 |
38 |
3.5 | |
Total |
54 |
5.3 |
51 |
4.7 |
55 |
5.1 | |
HCC residential children's homes |
Non-disabled |
31 |
3.0 |
35 |
3.2 |
30 |
2.8 |
Independent Fostering Providers (IFP) |
Non-disabled |
131 |
12.8 |
163 |
15.0 |
155 |
14.3 |
CWD |
12 |
1.2 |
12 |
1.1 |
13 |
1.2 | |
Total |
143 |
14.0 |
175 |
16.1 |
168 |
15.5 | |
HCC Fostering |
Non-disabled and CwD |
592 |
57.9 |
630 |
58.1 |
629 |
58.0 |
Other |
Non-disabled and CwD |
203 |
19.8 |
194 |
17.8 |
202 |
18.6 |
1,023 |
1,084 |
1,084 |
|||||
5.36. This table further demonstrates the overall increase in CLA since March 2008 and in particular those who are supported in either a residential or foster care placement. However, since March 2009 there has been some success in reducing the proportion of children who are supported within more costly arrangements with a corresponding increase in other arrangements (e.g. those placed at home on care orders and in supported lodgings).
CLA placed in either residential or foster care provision |
CLA in `other' types of arrangements | |||
Number of children |
Proportion of total CLA (%) |
Number of children |
Proportion of total CLA (%) | |
March 2008 |
820 |
80.2 |
203 |
19.8 |
March 2009 |
891 |
82.2 |
192 |
17.8 |
May 2009 |
885 |
83.1 |
180 |
16.9 |
June 2009 |
883 |
80.6 |
212 |
19.4 |
July 2009 |
894 |
82.8 |
186 |
17.2 |
August 2009 |
882 |
81.4 |
202 |
18.6 |
5.37. The general increase in the number of children supported in either foster care or residential provision (an increase of 62 since March 2008) has had a considerable impact on the budget pressure reported for 2009/10 and this will continue to increase during the financial year unless activity levels begin to stabilise over the next few months.
5.38. An analysis has been completed of the age profile of the Children Looked After population to determine whether there has been any significant change since March 2008. This identifies that a significant proportion of the overall increase since the end of March 2008 relates to children who are either aged between 0 to 4, 11 to 15 or 16+ years old (19.1%, 4.4% and 7.4% respectively). The increased number of 0 to 4 year olds could also possibly indicate that a greater number of children will require financial support over a longer period of time.
Age Group |
Number of CLA as at: | |||
31 March 2008 |
31 August 2009 |
Change | ||
Number |
% | |||
0 to 4 |
194 |
231 |
+37 |
+19.1 |
5 to 10 |
240 |
223 |
-17 |
-7.1 |
11 to 15 |
413 |
431 |
+18 |
+4.4 |
16+ |
176 |
189 |
+13 |
+7.4 |
Total |
1,023 |
1,084 |
+61 |
+6.0 |
5.39. Further analysis of this information, also taking into consideration the average length of time a child is in care for each age group, will be undertaken over the coming months to determine the potential impact on the Children's Services budget in future years.
5.40. An additional financial pressure may also emerge over the coming months following the conclusion of a recent case (G vs Southwark) regarding homeless 16/17 year olds. A ruling by the House of Lords on 20 May 2009 states that "local authorities should presume any lone, homeless children should be provided with accommodation under section 20 of the 1989 Children Act. Where the criteria for section 20 have been met, children's services do not have the discretion to choose to use section 17 powers instead to provide accommodation".
5.41. This means that the County Council has a statutory duty to carry out an initial assessment (and most likely a core assessment) for all 16 and 17 year olds and a potentially significant cost pressure could arise as a result. Further work is currently being undertaken by the department, and nationally by the Local Government Association, to determine the implications of this judgement.
5.42. Benchmarking comparisons are being undertaken with other local authorities to determine whether the increase in the number of CLA experienced in Hampshire is a national issue. The information provided by other local authorities suggest that a similar picture in terms of activity and budget pressures is emerging. Of the 20 local authorities who responded to the department's request for activity information, on average the number of Children Looked After across the group increased by 4.5% between June 2008 to June 2009. For the same period Hampshire observed an increase of 5.3%. The average number of CLA for all authorities during the first quarter of the year (to 30 June 2009) represents a 2.7% increase on the average for 2008/09, compared with an increase in Hampshire of 2.8% for the same period. However, as outlined in paragraph 5.34, it is important to note that the estimated average CLA activity for Hampshire for 2009/10 has increased to 1,084 (a 3.8% increase on 2008/09).
5.43. The forecast outturn as at the end of August 2009 is based on an assumption that current activity levels will remaining stable throughout the remainder of the financial year.
August 2009 Forecast Variance £000 | |
Purchased Residential Care (Non-County Placements (NCPs) and Secure Welfare*) |
-444 |
Purchased Fostering (IFPs) |
+1,305 |
HCC Fostering |
+411 |
HCC Children's Homes |
+534 |
Other Residential |
+63 |
Total |
+1,819 |
*Expenditure on Secure Welfare amounts to approximately £230,000 of the forecast outturn reported against purchased residential placements
Purchased Residential Care or Non-County Placements (NCPs)
5.44. The forecast underspend for NCPs is £444,000, or 5.0% of the cash limit of £8,955,000.
5.45. This budget includes both non-county residential children's homes and school placements as well as the externally sourced secure welfare placements.
5.46. The forecast is based on any known changes to current activity levels (55 placements as at the end of August 2009, an increase of four since March 2009. Activity levels of non-county placement had been stable for a relatively long period of time. However, in recent months the numbers have shown an increase, with further planned activity expected. This budget may therefore begin to experience further pressure if activity continues to grow in this area.
Independent Fostering Providers (IFPs)
5.47. The forecast outturn indicates an overspend of £1,305,000 which represents +21.8% of the cash limit of £5,976,100. This cash limit includes the reduction of £300,000 forecast savings included within the 2009/10 Budget Strategy.
5.48. The number of children placed with IFPs has reduced to 168 as at the end of August, compared to 175 in March 2009 (a net reduction of seven). Since the beginning of the current financial year 39 new IFP placements have been made and 46 have ceased.
5.49. Whilst an overall reduction in the number of placements has been observed since March it should be noted that this is a very recent reduction. Until August the number of placements remained relatively stable at around 170 to 177. The overall requirement for these placements has been considerably higher than had been budgeted for. Increased capacity generated within the in-house service has avoided the need for higher increases, but the increasing demand for foster care placements overall this year has resulted in the expected level of budget savings (as assumed in the foster care investment business case) not being achieved.
5.50. Activity in this area will continue to be monitored carefully during 2009/10, as clearly any increases in CLA during the remainder of the year could have significant effects on the full year outturn.
HCC Fostering Service
5.51. The current forecast outturn indicates an overspend of £411,000 which represents +3.7% of the cash limit of £11,167,600. This cash limit includes the growth of £600,000 agreed in the foster care investment business case for 2009/10.
5.52. The forecast is based on an assumption that current activity levels will remain stable for the remainder of the year. As at the end of August 629 children were placed with in-house foster carers, a net reduction of one placement since the end of March 2009.
5.53. However, growth in the overall number of children requiring a foster care placement over the last year has clearly impacted on the service's ability to react to the full level of demand for placements within the additional capacity generated which has resulted in the continued need to procure from Independent Fostering Providers (IFPs).
5.54. The following table outlines various comparisons between the number of children placed with in-house foster carers and Independent Fostering Providers, including the Foster Care business case base line assumptions and the business case target for August 2009.
Number of Children in Provision |
Business Case Baseline |
Adjusted Business Case Target Aug 2009 |
Client numbers at Mar 2009 |
Client numbers at Aug 2009 |
Increase in numbers from target position Aug 2009 |
In house foster care |
534 |
599 |
630 |
629 |
+30 |
Independent Fostering providers (IFP) |
142 |
127 |
175 |
168 |
+41 |
In house children : 1 IFP |
3.76 |
4.72 |
3.60 |
3.74 |
-0.98 |
5.55. Whilst this comparison demonstrates a lower ratio of children placed with in-house foster carers to those with IFPs for August 2009 than the business case target (3.74:1 compared with 4.72:1 respectively), this needs to be considered alongside the wider context of increasing numbers of CLA. Overall, an additional 30 placements have been made as at the end of August 2009 with in-house foster carers than had originally been envisaged when the business case was developed. This demonstrates the success of the foster care investment strategy so far in terms of avoiding additional expenditure which might have otherwise been incurred from an even greater use of IFP placements.
5.56. Additional investment will continue during 2009/10 on marketing campaigns targeted at recruiting new and experienced foster carers to the service and it is envisaged that further capacity will continue to be created within the service during 2009/10. Providing Children Looked After activity levels do not rise further it is anticipated that whilst a further budget pressure may emerge against the HCC fostering service, any additional capacity generated will contribute toward achieving a reduction in the number of IFP placements required. This should in turn enabling budget savings to be delivered. However, as indicated above this will be dependent upon future activity levels and demand for foster care placements stabilising
Residential Children's Homes
5.57. The current forecast outturn indicates an overspend of £534,000 which represents +8.9% of the cash limit of £6,022,000.
5.58. Many of the children's homes are reporting considerable overspends for 2009/10 as a result of demands against their staffing budgets (e.g. use of overtime and agency staff to cover sickness and holidays). A mixture of insufficient budgets to support current levels staffing in place due to higher levels of occupancy observed in some of the units during 2009/10 compared with 2008/09, together with the accommodation of some children requiring very intensive support and supervision (e.g. 1 to1 supervision and waking night staffing) has clearly impacted on the department's ability to manage within its available budget. This will be addressed as part of the 2010/11 budget setting process.
Family Support Services +£265,000 (+3.2%)
5.59. The overspend reported consists of:
August Forecast Variance | |
£000 | |
Direct Payments |
+85 |
Day Care |
-83 |
Services for Under 8s |
-7 |
Home Care |
+53 |
Equipment and Adaptations |
- |
Other Family Support* |
+217 |
Total |
+265 |
*Other Family Support includes expenditure on unqualified support workers, preventative expenditure and other non-CLA placement solutions (Residence Orders, Special Guardianship Orders and Kinship Care).
5.60. A significant proportion of the variance reported against `Other Family Support' relates to the increase in Residence Orders, Special Guardianship Orders and Kinship Care placements, as outlined in the following table:
Client numbers at March 2008 |
Client numbers at March 2009 |
Client numbers at August 2009 |
Increase since March 2009 | ||
Number |
% | ||||
Provision |
|||||
Kinship Care |
53 |
50 |
61 |
+11 |
+22.0 |
Residence Order |
116 |
132 |
130 |
-2 |
-1.5 |
Special Guardianship Order |
57 |
86 |
91 |
+5 |
+5.8 |
Total number of children |
226 |
268 |
285 |
+14 |
+5.2 |
5.61. The department had anticipated there to be little growth in the number of children supported via these types of arrangements in 2009/10. The actual growth in numbers which has been experienced, therefore, has resulted in a forecast overspend being reported against the original budget set.
5.62. Other budget pressures reported include direct payments, which has also experienced a further increase in activity (from 173 as at the end of March 2009 to 187 at the end of August 2009, a net increase of 14), along with an increase in home care packages.
Youth Justice (including Secure Unit) -£222,000 (-65.3%)
5.63. The underspend reported reflects the current assumption around the sale of beds at Swanwick Lodge to the Youth Justice Board and other Local Authorities.
Other Children's Services +£1,027,000 (+13.5%)
5.64. The forecast overspend consists of:
August Forecast Variance | |
£000 | |
Adoption Services |
+366 |
Leaving Care Services |
+268 |
Other Children's Services |
+393 |
Total |
+1,027 |
5.65. The overspend reported within the adoption service has arisen for a number of reasons including anticipated expenditure on interagency placements resulting from an increase in the number of externally arranged adoption placements, as well as an increase in expenditure on adoption allowances since last year. The average number of children who were being financially supported through adoption allowance payments in 2008/09 was 225, compared with an average of 238 as at the end of August, an increase of 5.8%.
5.66. The overspend against the Care Leavers budget reflects a steady increase in the number of care leavers who are continuing to be supported by the department since 2006/07. This is demonstrated in the graph below:
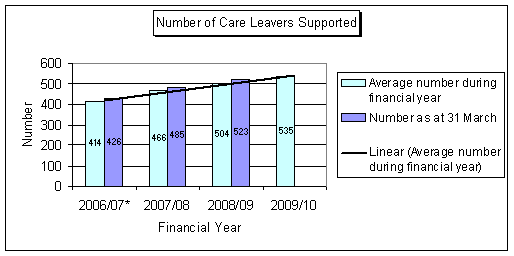
* Average figure for 2006/07 is based on period August 2006 to March 2007 only.
5.67. This change represents a 6.1% increase since 2008/09 in the average number of care leavers who continue to be supported by the County Council. Further work is being undertaken as part of the budget recovery plan to review the current support packages for care leavers and the future potential impact on this budget as a result of the increased numbers of children looked after by the County Council.
5.68. The overspend within the Other Children's Services budget is mainly due to pressures relating to the provision of social care related transport for children. Further management action is being taken to address this level of overspend through reviewing the current provision of transport to support contact arrangements for Children who are Looked After.
Services for Young People - Connexions Consortia and District Youth Teams +£152,000 (+1.3%)
5.69. These teams are reporting a combined overspend due to a number of budget pressures in relation to staff costing in excess of the budget provision allowed. This is partly due to a large number of staff being paid above the mid-point of the salary grade as well as a number being appointed at a higher grade than had originally been budgeted for due to the extent of their experience.
Unallocated Budget -£605,000 (-66.6%)
5.70. A small department contingency of £150,000, included within this budget, has been retained with the intention of offsetting any pressures which may emerge throughout the year.
5.71. Whilst some of the contingency has been earmarked to offset a number of emerging funding pressures during 2009/10 the remaining budget will be used to offset the significant overspend position reported by the department.
6. Children's Centres
6.1. Children's Centres are a Government initiative intended to provide better outcomes for children, families and local communities, acting as a local hub for a wide range of integrated services.
6.2. The total funding for Children's Centres in 2009/10 is £14.6m, of which £8.0m relates to the Children's Centres service budget. The remaining £6.6m relates to funding provided to the business unit (which is considered separately in paragraph 7.3). This overall funding is made up of Sure Start, Early Years and Childcare grant funding, as well as a carried forward contribution of £1.4m Dedicated Schools Grant agreed by Schools Forum.
6.3. The Children's Centres Service is currently reporting a projected balanced budget in respect of school managed and third party centres, support related expenditure, and centrally allocated budgets. This is summarised in the table below:
Budget |
2009/10 Variance | |
£000 |
£000 | |
School managed and third party children's centres |
11,465 |
17 |
Children's Centres support costs |
1,294 |
9 |
Children's Centres Service central expenditure |
1,415 |
(26) |
Total |
14,174 |
0 |
7. Business Units
7.1. Appendix 3 shows that total reserves at 1 April 2009 were £6.1m (Schools services £4.7m, Children's Centres £1.4m). It also details the business unit forecast year end unit balances as at the end of August 2009 compared with the original budget. This shows that an overall in-year deficit balance of £1.3m is expected for the business units supporting Schools and a £0.8m deficit for the Children's Centres business unit. This will result in the overall reserves of the Business Units as at the 31 March 2010 reducing to £4.0m (£3.4m for Schools services and £0.6m for Children's Centres).
Business Units supporting Schools
7.2. The in-year deficit position reported for business units supporting Schools primarily relates to:
· Hampshire Inspection and Advisory Service (HIAS) - A forecast deficit of £948,000 is part of a planned strategy to utilise the Unit's accumulated surplus, which stood at £2.974m as at 31 March 2009, over the next three years. The business unit has increased its contribution towards the costs of the National Strategies Consultants' in accordance with the 2009/10 Children's Services Budget Strategy. In addition, HIAS will fund the continuation of market supplement payments and the shortfall on core funding as no inflation allocation has been given for 2009/10. Increased costs associated with School Improvement Partner work must also be met by the Unit. Furthermore, there is an anticipated reduction in the level of surplus at Hampshire Teaching and Leadership College (HTLC) mainly related to additional costs. HIAS total reserves are therefore forecast to reduce to £2.0m as at 31 March 2010.
· Education Information and Communication Technology (EdICT) - the business unit currently forecasts a deficit for 2009/10 of £243,000 which would reduce the Unit's reserves to £306,000 as at 31 March 2010. As there is still some uncertainty regarding the value of a number of EdICT's income streams, this projection should continue to be treated with some caution until these can be confirmed.
Children's Centres Business Unit
7.3. It is currently envisaged that an in-year deficit position of approximately £790,000 will occur during 2009/10 for the Children's Centres business unit, reflecting plans to improve facilities and services in communities where Children's Centres are based. This will result in an overall reserve balance of approximately £590,000 as at 31 March 2010. This includes a carry-forward of £0.4m Dedicated Schools Grant to 2009/10 as agreed with Schools Forum.
8. Grants
8.1. The total of all the elements within the Area Based Grant (ABG) for Children's Services is £24.0m. The ABG has no conditions attached to it and is treated as part of the overall department resource. Any over or underspend will therefore be subject to the usual rules around carry-forward as part of the department's overall cash limit. The impact of changes in ABG for 2010/11 will be considered as part of the medium-term budget strategy.
8.2. The total value of the department's specific grants (excluding the Dedicated Schools Grant, School Development Grant and Schools Standards Grant) is £59.6m. Expenditure against these grants is being closely monitored to ensure that any potential underspends are identified early on, maximising the use of these funds where ring-fenced (e.g. SSEYCG) and identifying any potential carry-forward to 2010/11 within the scope of the grant conditions.
9. Partnerships
9.1. Within Children's Services there are two significant partnerships - Wessex Youth Offending Team (YOT) and the Hampshire CAMHS Commissioning Partnership. A partnership is considered to be significant where the County Council has a net financial impact estimated to be in excess of £0.250m over the life of partnership.
Wessex Youth Offending Team
9.2. The Wessex Youth Offending Team (YOT) is funded primarily by the Youth Justice Board (YJB) and partner organisations (whose contributions may be in cash and/or in kind). For 2009/10 the Children's Services contribution will be approximately £3.8m, which consists of the core contribution of £2.4m plus a number of other funding streams.
9.3. The Wessex YOT Management Board receives regular finance and performance reports. At its meeting on 9 September 2009 the Board received an update on the financial position for 2009/10 outlining a projected overspend of £38,000 against the available budget of £10.4m.
9.4. This has mainly arisen due to a proposed reduction in the contribution from the Police Authority partly in response to proposals to re-structure the staffing profile of police officers (from six Police Officers to four police officers and two Civilian Workers). However, this would result in a net cost to Wessex YOT of £30,400. Ongoing discussions are taking place with Hampshire Constabulary to resolve this issue.
Hampshire CAMHS Commissioning Partnership
9.5. The Hampshire CAMHS Commissioning Partnership (new title following consideration by the management Board on 8 September 2009 - formerly the Comprehensive CAMHS Commissioning Trust) provides services focused on promoting and restoring the emotional well-being of children and young people. The partnership is between Hampshire County Council and the Hampshire Primary Care Trust. Most services are commissioned through contract arrangements. These include NHS providers and other organisations who provide support for children and young people with emotional, social, and mental health needs.
9.6. At its meeting on 8 September 2009 the partnership's Management Board received an update on the financial position for 2009/10. This reported a forecast underspend for the year of £270,000, although plans to spend £40,000 were approved, together with further consideration on other proposals to be reported back to the next meeting in December. However, it is envisaged that a proportion of this will be returned to partners. This could amount to a repayment of approximately £50,000 to £60,000 for Children's Services if agreed.
10. Efficiencies and Savings Targets
10.1. An update of the current achievement against the department's savings targets for 2009/10 of £3,558,000 is shown in Appendix 4. This identifies that £2,496,000 of this overall target is currently expected to be achieved.
10.2. The key areas where the target is not currently reported as being achieved are:
· £300,000 in respect of Independent Fostering Provider placements. This is primarily due to growth in the number of children who are looked after by the County Council
· £200,000 in relation to Home to School Transport. Growth in the number of children being transported has impacted on the ability to generate budget savings
· £562,000 of the £1,562,000 `savings to be identified' target. The department has been successful in absorbing in the region of £1m of this savings target. However, additional budget pressures are expected to impact on the departments ability to manage within it's available cash limit.
10.3. Children's Services is engaging fully with the County Council efficiency programme and will be making contributions to the corporate targets in workstyle, home to school transport, contracting work, transition as well as various other measures. In addition Children's Services management team are considering what further efficiency measures can be taken that can help offset future departmental pressures.
11. Future direction
11.1. The department will monitor its forecast outturn against the available cash limit throughout 2009/10 using a risk based approach to reporting variances. A regular update report will be presented to the Executive Lead Member for Children's Services outlining any key or high risk issues.
11.2. This information will be used as part of a wider integrated service planning approach by the department to inform the proposed budget for 2010/11 to 2012/13.
12. Appendices
12.1. The following appendices are attached:
Appendix |
||
1 |
Budget Monitoring Summary | |
2 |
Activity Data |
(a) termly (b) monthly (c) Key activity figures reported to Cabinet as at 30 June (d) Workforce Information as at 30 June |
3 |
Forecast Business Unit balances | |
4 |
Savings Targets | |
13. Recommendations
13.1. Agree the current financial issues that are being addressed within the 2009/10 budget and the management action required in the areas of particular pressure.
13.2. Receive a detailed progress report on the key activity, spending pressures and recovery plan actions at the next Decision Day.
13.3. Note the latest financial position of the Wessex Youth Offending Team and the Hampshire CAMHS Commissioning Partnership.
13.4.
CORPORATE OR LEGAL INFORMATION:
Links to the Corporate Strategy
Hampshire safer and more secure for all: |
Yes |
Corporate Business plan link number (if appropriate): | |
Maximising well-being: |
Yes |
Corporate Business plan link number (if appropriate): | |
Enhancing our quality of place: |
No |
Corporate Business plan link number (if appropriate): | |
Other Significant Links
Links to previous Member decisions: |
|||
Title |
Reference |
Date | |
Children's Services Revenue Budget 2009/10, 2010/11 , 2011/12 |
Item 2 |
21 January 2009 | |
Children's Services Department 2008/09 Revenue Budget Final Position and 2009/10 Budget Monitoring - Period 2 (End of May 2009) |
Item 1 |
22 July 2009 | |
Direct links to specific legislation or Government Directives |
|||
Title |
Date | ||
Section 100 D - Local Government Act 1972 - background documents | |
The following documents discuss facts or matters on which this report, or an important part of it, is based and have been relied upon to a material extent in the preparation of this report. (NB: the list excludes published works and any documents which disclose exempt or confidential information as defined in the Act.) | |
Document |
Location |
IMPACT ASSESSMENTS:
1. Equalities Impact Assessment:
1.1. Equality and diversity objectives are not considered to be adversely affected by the proposals of this report.
2. Impact on Crime and Disorder:
2.1. Crime and disorder objectives are not considered to be adversely affected by the proposals of this report.
3. Climate Change:
a) How does what is being proposed impact on our carbon footprint / energy consumption?
· No impact
b) How does what is being proposed consider the need to adapt to climate change, and be resilient to its longer term impacts?
· No impact