
JSNA Demography
Data in this summary is correct as at June 2026
JSNA Demography Summary Report
This summary report presents the key demographic data and trends across Hampshire. The data presented focuses on:
- age structure of our population and future projections,
- socio-demographic and protective characteristics of our population,
- deprivation.
Hampshire County Council's 2024-based Small Area Population Forecasts data have been used to describe the resident population of the county and how this population is forecast to change.
Measures of mortality and morbidity, life expectancy, and healthy life expectancy, are also discussed to provide an overall measure of population health.
The data in the summary report below can be explored further and in greater detail for areas such as Middle Super Output Areas (MSOAs), districts, Integrated Care Boards and Primary Care Networks by using the JSNA demography data report.
This link opens a Power BI presentation. Power BI is an interactive data visualisation software developed by Microsoft.
Understanding how the population structure in Hampshire has changed over time is important. This information can help explain the population patterns and trends we see now which influence our health. This short animation shows our changing and ageing population structure. It shows data from the first census in 1861 to the population reported in the 2021 census. The solid bars represent the Hampshire population, and the lines are England and Wales population for comparison.
Resident Population of Hampshire
Age and sex structure of the resident population
The population of Hampshire in 2024 is estimated to be 1.436 million people. There are slightly more females (51%) than males.
Compared to England, Hampshire has an older population structure. It has a greater proportion of the population aged 50 years and over, and a lower proportion of working age, 20 to 44 years.
- Young people (aged 0-19 years) make up 21.9% of the population compared to 23.1% nationally.
- Hampshire has fewer young working age people (aged 20-44 years) compared to England as a whole; 28.7% in Hampshire compared to 33.2% in England.
- Older people, aged 70 years and over, make up 16.9% of the population compared to 13.7% nationally.
- 1.2% are in the 'oldest old' over 90 years population age group compared to 0.9% in England.
Figure 1: Hampshire resident population age and sex structure compared to England
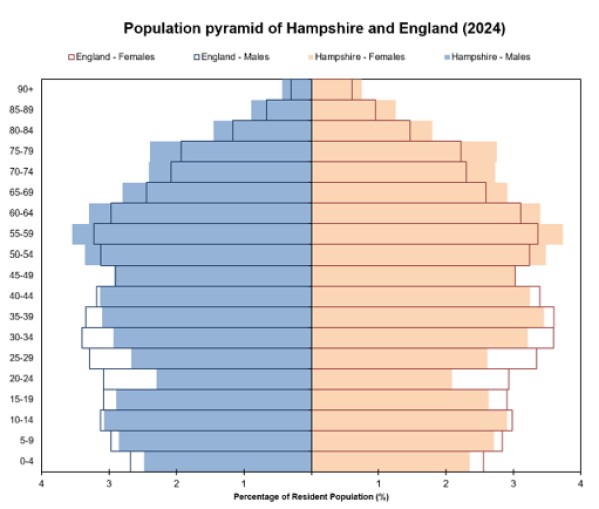
Source: HCC 2024-based Small Area Population Forecasts. England ONS 2024 midyear population estimates.
Resident population change
The population of Hampshire is forecast to increase by 6.6% from 2024 to 2031, this equates to an increase of 94,300 people.
Hampshire district populations are all forecast to increase, although the proportion of increase varies.
The most growth over the next few years is forecast to occur in Winchester district where the population is expected to increase by 10.8% (a rise of 14,700 people) by 2031. Conversely Gosport's population is forecast to increase by just 3.3% (a rise of 2,740 people).
The population of Hampshire is ageing, with increases predicted mainly amongst the older population, aged 80 years and older.
Figure two shows that the districts with the largest increases in this older population are:
- Basingstoke and Deane
- Rushmoor
- Test Valley
In these districts the population aged over 80 years population is forecast to increase by over 39.9% between 2024 and 2031.
Figure 2: All age and 80 years and over population forecasts between 2024 and 2031
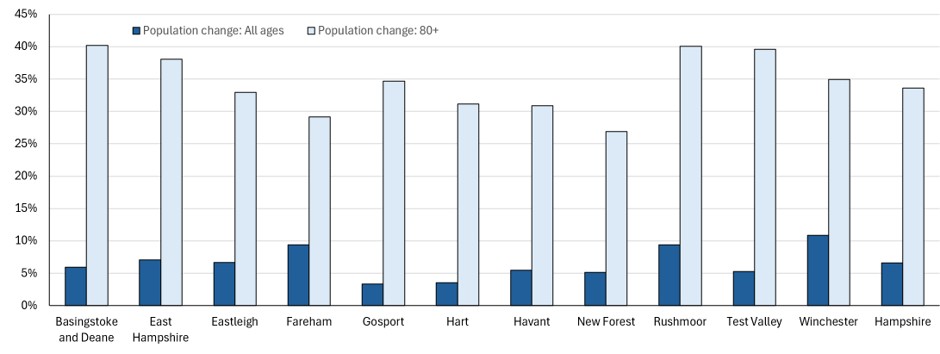
Source: HCC 2024-based Small Area Population Forecasts
Population density
Population density refers to the number of people living in an area. Overall, Hampshire’s population density is lower than England, 385 people per square kilometre in Hampshire compared to 438 per square kilometre in England.
Population density varies greatly across the county, from 198 people per square kilometre in Winchester to 3,243 people per square kilometre in Gosport. Higher population density is generally correlated to the urban rural classification of the area.
Those classified as predominantly urban have a greater population density. These are Eastleigh, Fareham, Gosport, Havant and Rushmoor.
Indices of deprivation
Hampshire is among the least deprived authorities in England according to the Index of Multiple Deprivation (IMD) 2025, although there are pockets within Hampshire that fall within the most deprived areas in the country.
Hampshire is the 17th least deprived Upper Tier Authority in England (ranked out of 153 authorities). At a district (lower tier) level, Hart is the least deprived area in England. Our most deprived areas in the 20% most deprived LSOAs nationally are in Havant, Gosport, Rushmoor and the New Forest, with pockets also being seen within Basingstoke and Deane. Gosport is the most deprived district in Hampshire ranked 101st out of 317 districts, placing the district in the top 40% most deprived authorities.
Comparing deprivation between the 2019 and 2025 IMD suggest an increase in place-based deprivation in Gosport, notably in Gosport Town.
Two supplementary indices are produced alongside the income deprivation domain which explore income deprivation specifically affecting children (0 to 15 years) (IDACI), and older people (aged 60 years and over) (IDAOPI).
The income subdomains for children and older people suggest:
- 6% of children in Hampshire aged 0 to 15 years are living in income deprived families
- IDACI ranks 14 areas in Hampshire in the most deprived decile nationally, nine of these are in Havant and 4 are in Gosport
- 4% of residents aged 60 or over experience income deprivation
- IDAOPI ranks 19 areas in Hampshire in the most deprived decile nationally, ten of these are in Rushmoor and four are in Havant
These data show there is marked inequality across the county with areas of significant deprivation affecting children and older people.
Protected characteristics
The Census is the most robust source of information about the protected characteristics of the resident population for Hampshire. This section looks at the data from the 2021 Census and where possible makes comparisons to the 2011 Census.
Ethnic minority groups
The Hampshire population is less diverse than England as a whole, with 92.6% of residents describing themselves as belonging to White ethnic groups compared to the national average of 81%. The diversity of the area's population is increasing, 7.4% of the population described themselves as of an ethnic background other than White in 2021, up from 5% in the previous census conducted in 2011.
Basingstoke and Deane, and Rushmoor, both in the north of the county, are more diverse when compared to Hampshire overall. Urban areas in particular across the county tend to have higher ethnic group diversity. Over 23% of the Rushmoor population are from a non-white British ethnic group, with over 10,575 people identifying themselves as Nepalese in the 2021 Census.
Overall, the white population of Hampshire has higher proportions of people in the older age groups. The demographic of the population who are from an ethnic minority group is younger.
Disability
To understand the level of disability in our population the responses from the Census 2021 question were analysed. It asked, do you have any physical or mental health conditions lasting or expected to last 12 months or more?
Across Hampshire 75.4% of people did not have any conditions or illnesses which reduced their ability to carry out day-to-day activities. This is slightly lower than England proportion of 75.9%.
In Hampshire as a whole, 5.8% of people said they had a condition or illness which limited their day-to-day activities a lot. This varied across the county between 4.2% in Hart to 7.7% in Gosport.
Religion or belief
Census 2021 data show slightly over half of Hampshire residents (51.5%) stated they had a religion, 42.8% no religion and 5.7% did not say.
Christianity was the dominant religion with 47.8% of Hampshire residents reporting to be Christian. 1.1% reported to be Hindu, 0.9% Muslim and 0.8% Buddhist.
Across the districts religion varied the most in Rushmoor, reflecting the greater ethnic diversity in this district. Christianity remained the dominant religion, but the proportion was lower than Hampshire (42.3%). 5.7% reported Hindu as their religion, 2.5% Muslim and 4.7% Buddhist.
Marriage and civil partnership
Census 2021 data reported that slightly over half of Hampshire residents (50.9%) were married, 30.7% never married and never registered a civil partnership, 9.7% divorced and 6.6% widowed or a surviving partner from a civil partnership.
The highest proportion of people who never married and never registered a civil partnership were in Basingstoke & Deane (33.4%) and Rushmoor (35.5%).
New Forest reported the highest proportion of people widowed or surviving partner from a civil partnership (8.3%).
Gosport reported the highest proportion of people divorced or formerly in a civil partnership which is now legally dissolved (12.3%).
Pregnancy and maternity
Smoking during pregnancy can cause serious pregnancy-related health problems. These include complications during labour and an increased risk of miscarriage, premature birth, stillbirth, low birthweight and sudden unexpected death in infancy.
Smoking in pregnancy has well known detrimental effects for the growth and development of the baby and health of the mother. On average, smokers have more complications during pregnancy and labour, including bleeding during pregnancy, placental abruption and premature rupture of membranes.
Recent data for the financial year 2024/25 suggest that in Hampshire 6% of mothers (717 mothers) were known to be smokers at the time of delivery. Rates across the county are currently very similar, with Winchester (66 mothers), Test Valley (75), New Forest (66), Havant (68), Gosport (43), Fareham (48), Eastleigh (78), East Hampshire (59) and Basingstoke and Deane (116) all recorded at 6.1%, leaving just Hart at 5.2% (44 mothers) and Rushmoor at 4.9% (55 mothers).
Trend data show that since 2010/11 the percentage of mothers smoking in Hampshire has been decreasing and remains comparable to England with the lowest percentage occurring 2024/25. At district level no district saw an increase between 2023/24 and 2024/25. East Hampshire, Fareham, Gosport and Havant saw a decrease with all other districts having no significant change.
Sexual Orientation and gender identity
In the 2021 Census, 91.3% of Hampshire residents identified as ‘Straight or Heterosexual’. This was similar across all districts. 1.2% identified as ‘Gay or Lesbian’, this varied from 1.0% in the New Forest to 1.6% in Gosport. 1.1% identified as ‘Bisexual’, this varied from 0.8% in Hart and the New Forest to 1.7% in Winchester. 0.3% identified as ‘All other sexual orientations’ this was similar across all districts. 6.2% did not answer.
95% of Hampshire residents identified their gender as being the same as registered at birth. 0.35% identified their gender as being different to that registered at birth. 4.6% did not answer. At district level, those who identified as being a different gender to that registered at birth ranged from 0.23% in the New Forest to 0.75% in Rushmoor.
In Hampshire, of those who identified as being a different gender to that registered at birth, 0.1% identified as ‘Trans Woman’, 0.1% as ‘Trans Man’, 0.1% identified as ‘Non Binary’, less than 0.1% identified as ‘other’ and 0.1% did not specify a gender. With the exception of Rushmoor, where 0.4% identified as being a different gender to that registered at birth but did not specify which gender they now identify as, all other districts had very similar percentages.
Life expectancy and healthy life expectancy
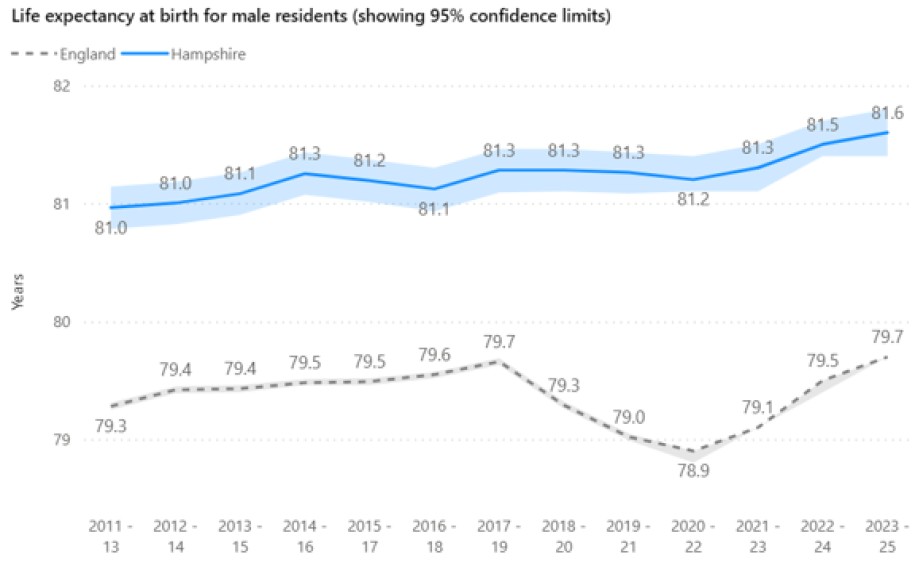
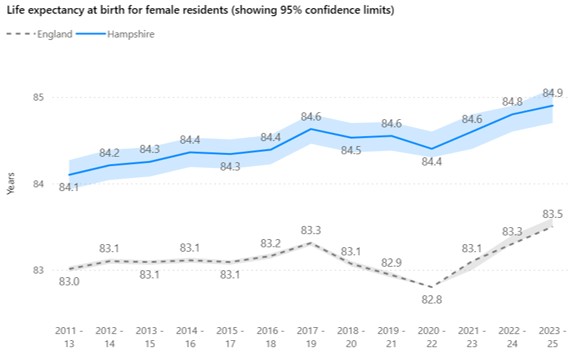
Overall, Hampshire’s population health is better than England. A boy born in Hampshire today will live on average for 81.6 years, this is just less than two years longer than the average for England (79.7 years). A girl born in Hampshire today will live on average for 84.9 years, this is just less than one and a half years longer than the average for England (83.5).
Life expectancy varies with deprivation and is a key high level inequalities outcome measure. Males living in the most deprived areas of Hampshire could expect to live 6.8 years less than those in the least deprived areas. While females living in the most deprived areas of Hampshire could expect to live 5.6 years less than those in the least deprived areas.
Across Hampshire life expectancy for males and females has been increasing over time, however, the inequality in life expectancy for females between the most and least deprived areas has increased by a year over the last five years.
Figure 3 and 4: Trend in life expectancy for Hampshire males and females
Healthy life expectancy shows the years a person can expect to live in good health (rather than with a disability or in poor health). It is therefore a significant measure of a person's quality of life.
Life expectancy estimates show females live for longer compared to men but they also live in poor health for longer too. Male healthy life expectancy is 64.3 years, indicating an additional 17.3 years are spent in poor health. Female healthy life expectancy is 64.8 years, indicating an additional 20.1 years are spent in poor health.
Over the last few years healthy life expectancy has been decreasing for both males and females, with a bigger decrease observed in females' healthy life expectancy. This suggests people overall are living longer in poor health while life expectancy has remained steady over the same time period.