Hampshire’s carbon emissions​

Hampshire County Council has a target for the Hampshire area to be carbon neutral by 2050. To assess our progress towards this target, carbon emissions are tracked and reported annually. Understanding where carbon emissions are coming from in Hampshire helps the Council to understand priority areas of action for reducing emissions.

Where carbon emissions come from in Hampshire​
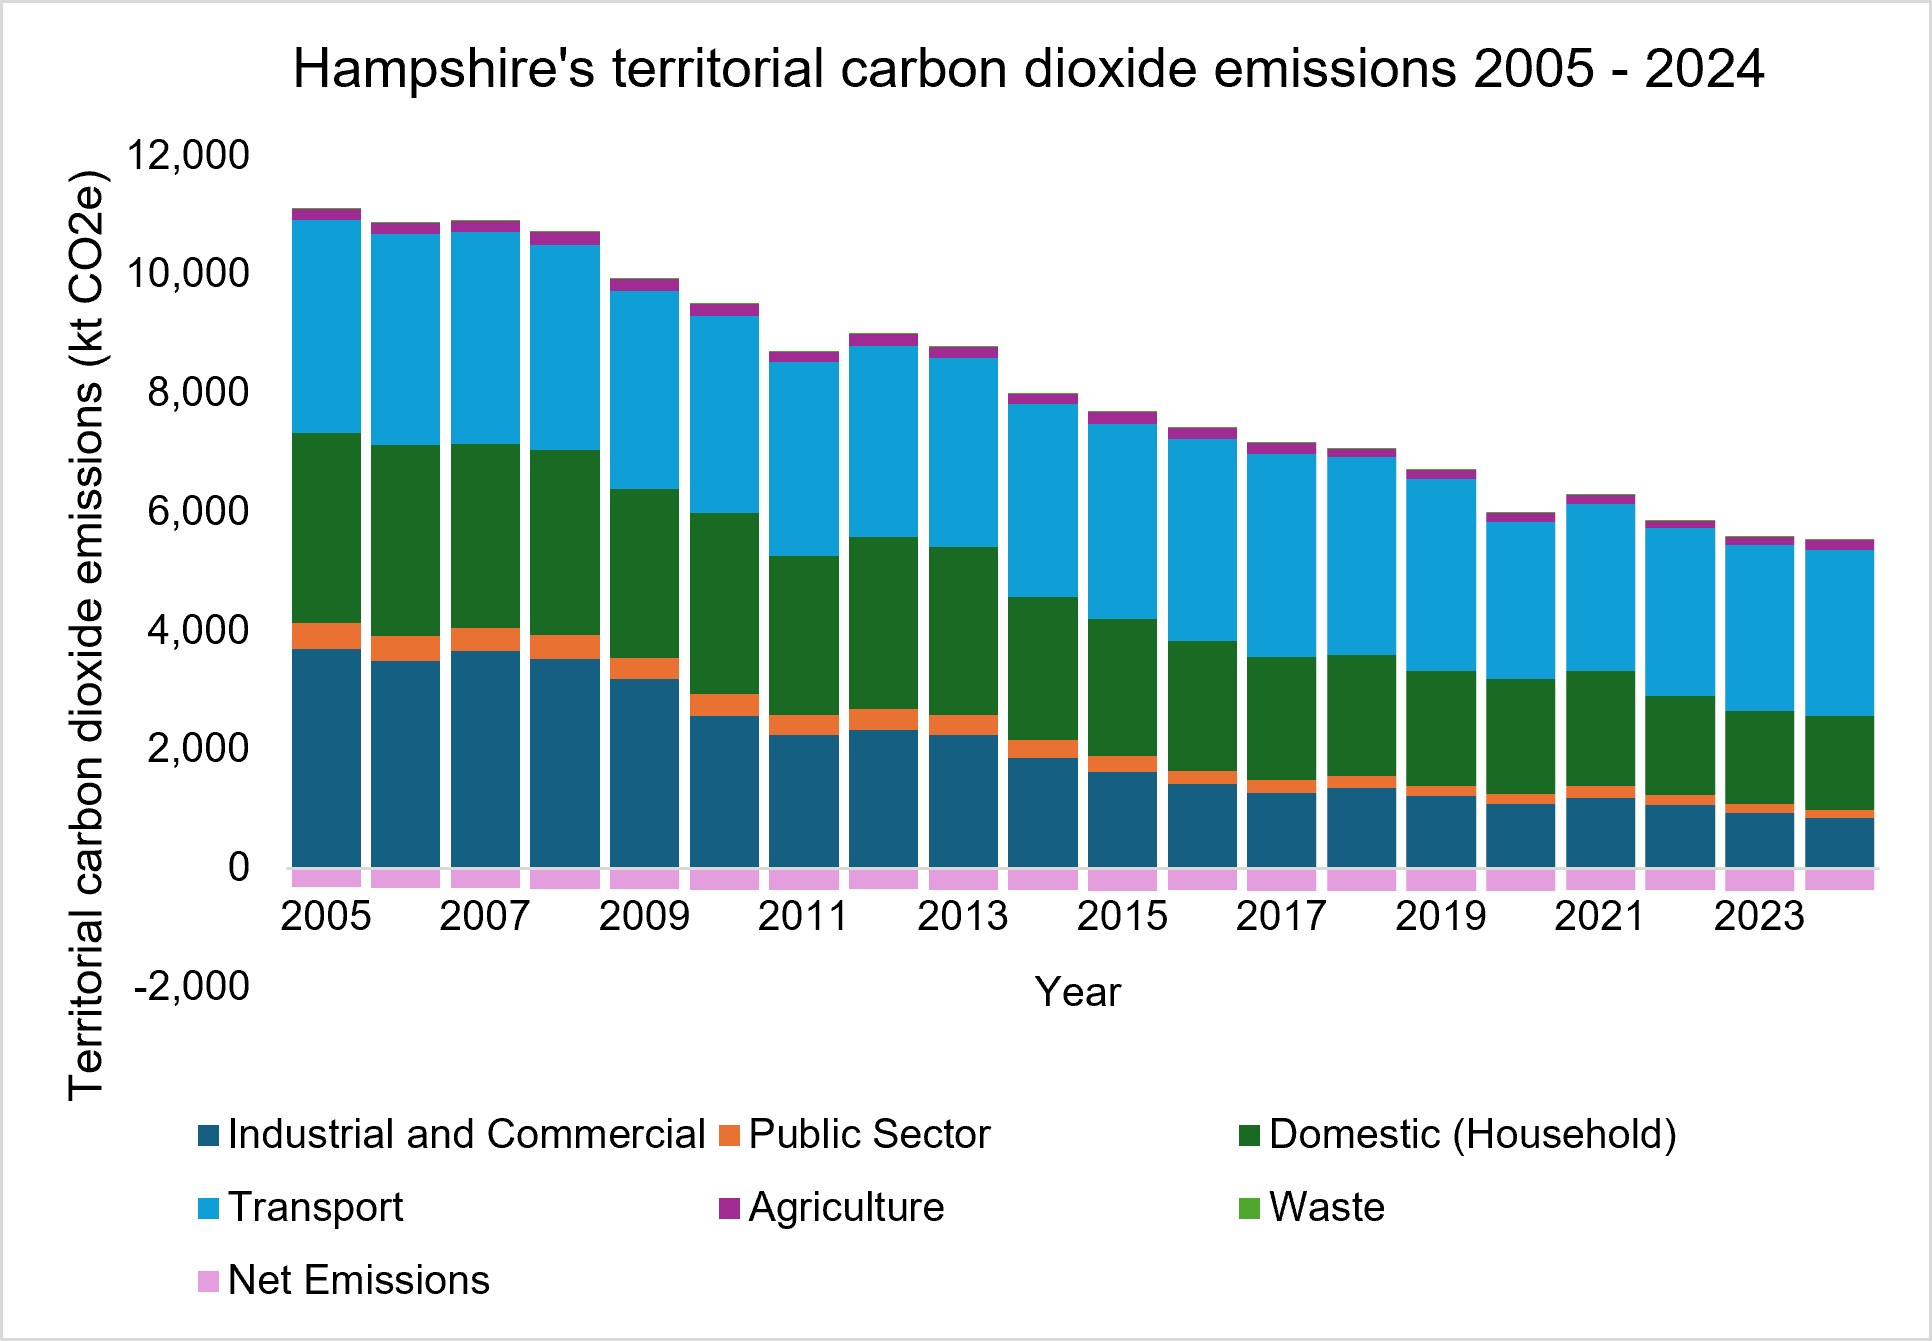
Using Local Authority and Regional data provided by the government department, Department for Energy and Net Zero, it can be seen that Hampshire emitted 6,008.40 ktCO2e in 2021. This is a reduction of 46% since 2005.

Transport is responsible for the majority of emissions followed by household emissions, and the industrial and commercial sector.

For more information about the datasets and a detailed look at the trends, please take a look at the baseline carbon emissions report and the latest annual report.

Emissions report 2022

  • 47.04% Transport
  • 32.54% Household (Domestic)
  • 19.46% Industrial and Commercial
  • Public sector
  • 3.75%
  • Agricultural
  • 2.27%
  • Waste Management
  • 0.99%

*The total emission percentages are over 100% as land use accounted for the removal of 6% of emissions in 2021.

The latest baseline emissions data

There is a two-year lag in data released by the government, which is why this year’s recorded emissions refer to 2021 results. The 46% reduction of emissions from 2005 to 2019 can be seen in the graph below.

In 2021, 6,023 ktCO2e of carbon dioxide emissions were released in Hampshire. Transport produced the greatest proportional percentage of emissions at 46.93%, followed by the household (domestic) sector at 32.46%.

Carbon Dioxide Emissions Chart
Carbon Dioxide Emissions Chart 2021

This year, methane and nitrous oxide emissions were also analysed.

In 2021, 463.3 ktCO2e of methane emissions was released into the atmosphere in Hampshire. Agriculture had the greatest proportional percentage of methane emissions at 38.13%, followed by waste management at 36.74%.

In 2021, 261.9 ktCO2e of nitrous oxide was released into the atmosphere, due to activities in Hampshire. Agriculture had the greatest proportional percentage of methane emissions at 65.81%.

Methane Emissions Pie Chart 2021
Nitrous oxide emissions chart 2021

Sign up for news on climate change action in Hampshire

    • Fill in all fields correctly. A technical error has occurred Thank you – please check your inbox now. You must confirm your email address to complete your subscription.

Privacy and data protection

The personal data you provide in this form will be treated in accordance with the General Data Protection Regulations and will be processed within the European Economic Area (EEA).

Your data will only be used by Hampshire County Council to provide you with news and information on the subjects you have requested. The County Council may use your data to better target our communications to you so that you receive more information about the things which interest you.

Your details will be shared by the County Council with third party companies SAP and AWS, who are acting only on our instructions and under contract, in order to send out the news and information by email.

The data you supply will be retained on an ongoing basis, until such time as the newsletter ceases to exist or you choose to unsubscribe from that newsletter. You can unsubscribe at any time using the ‘Manage my subscriptions’ or ‘Unsubscribe’ links contained in our newsletters. If you have a Hantsweb account, you are also able to amend your subscriptions there.

You have some legal rights in respect of the personal information we collect from you. For more information, see our privacy notice. You can also contact the County Council’s Data Protection Officer at [email protected]. If you have a concern about the way we are collecting or using your personal data, you should raise your concern with us in the first instance or directly to the Information Commissioner’s Office at https://ico.org.uk/concerns/

Hampshire scenary